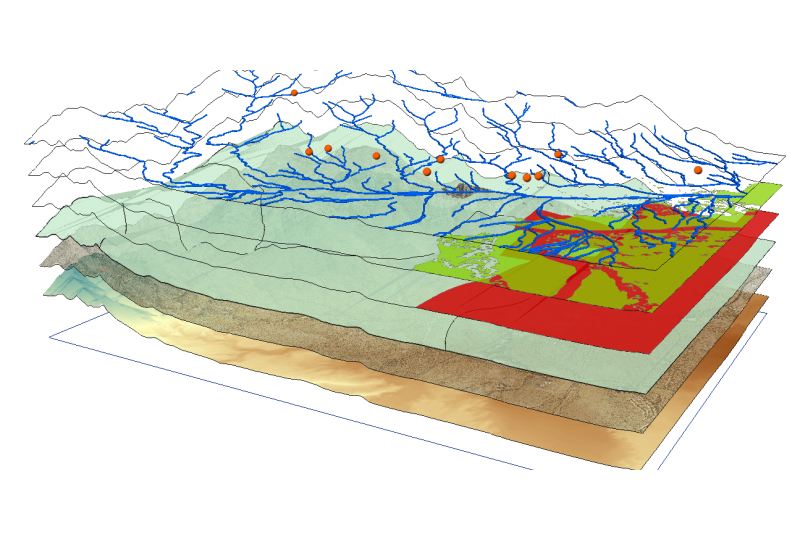
My new GIS portal
I have finally gotten to creating a GIS portal for publishing all kinds of geographic data.
Two of my hobbies are OSINT and GIS - the collection of freely available information and displaying it on electronic maps. I generally like doing stuff with geographic information. However, until recently, I haven’t had a good way to share geographically based information that interest me and might be interesting to other people too. I can add a map block to an article, yes, and of course, I could take screenshots and post them in my blog, but that map block doesn’t show much and a screenshot is static, while the information I want to share, might be dynamic. Maps themselves can also change.
The first option for publishing such information was writing my own map application. There is Leaflet and OpenLayers, two great web mapping applications, but that would have involved a lot of coding from the start and also to add new information. More than I have time for, unfortunately. Then there is a lot of great solutions like GeoNode but those usually involve a database - something I wanted to get and stay away from, hence my change to the static site generator Jekyll as my platform for my website a while ago.
But I recently ran across Masterportal, an open source GIS portal application developed by the Department of Geoinformation and Survey of the City of Hamburg, Germany. Masterportal works with static configuration files and gets its geographical data via various APIs from a map server. I do already run MapServer as a personal map server for a few years, so Masterportal is a great fit. Masterportal has one quirk in that is wants to get the metadata for the geographic information from a CSW server, but thanks to some creative templating in Jekyll, I could circumvent this. After about a week of testing, I was ready to deploy Masterportal as an integral part of my website now.
With this combination, I can easily create data layers via QGIS, push them to my map server and then edit the configuration of Masterportal to include them.
For starters, I have added background and topographical maps of Finland as background maps and the first data layers are electricity transport prices for apartments and small houses of Finnish operators (I’m planning to write a blog about those in the future) as well as up to date radiation dose rate measurements from the measuring station network of STUK, the Nuclear Safety Authority of Finland.
If you want to give it a try, go to the GIS portal and click on “Add layer” to display the layer that interests you. In the tools menu you find some additional tools such as displaying a legend for the layer.
